
Seeing is Believing Computer Vision for Precision Crop Irrigation
- Professor Balthazar

- Apr 16, 2024
- 6 min read
Updated: Apr 15
Over the years, numerous publications have explored the potential of RGB and multispectral imaging for determining crop coefficients based on canopy cover, subsequently linking this to crop water use. However, a common thread in these studies is the reliance on manual image capture, with subsequent lab processing. I have yet to encounter a truly affordable and automated system that fully harnesses this promising concept.
In my view, two fields stand to gain significantly from such automation: plant breeding, particularly in high-throughput phenotyping, and controlled environment agriculture. Yet, the current trend of immediately jumping to complex AI solutions has, to some extent, overshadowed simpler, yet highly effective approaches like the one described here. This oversight may stem from the intense focus of many data scientists on programming languages (like Python), statistics, and machine/deep learning, sometimes leaving less room for fundamental principles of physics and crop physiology.
My initial article on this topic, published in 2021, was quite brief. This revised and expanded version includes additional insights and, importantly, a link to the GitHub repository containing the source code for calculating actual and potential transpiration.
The primary goal of this article is to provide a foundational understanding of how imaging technology, an evapotranspiration (ET) model, and readily available microclimate data (solar radiation, relative humidity, air temperature, and wind speed) can be integrated to estimate the water consumption of various plants, whether grown in pots, as vegetables, or in row crops.
The ET-Based Approach to Water Management
Currently, the predominant method for monitoring plant and soil water status, and consequently scheduling irrigation, relies on soil moisture sensors. While there has been academic and corporate interest in utilizing plant-based sensors, consistent and reliable results have proven elusive. This begs the question: is there a viable alternative to directly measuring substrate moisture to ascertain the water requirements of potted plants? The answer is a resounding yes.
A compelling alternative lies in ET-based irrigation scheduling, which determines irrigation needs based on the potential crop water use (ETc). This is typically estimated daily using an evapotranspiration (ET) model and a crop coefficient (Kc). A significant challenge, however, is the lack of established crop coefficient values or curves for many crops, especially those cultivated in containers. The solution is to develop your own "crop coefficient curve" – a process that needs to be done only once per growing cycle and can then be applied to future measurements.
Developing Your Crop Coefficient Curve: A Step-by-Step Guide
Here's a straightforward method to determine the crop coefficient (Kc) for your specific crop:
Select Representative Plants: Choose a subset of plant pots that accurately represent the overall population.
Measure Actual Water Consumption (ETa): To determine the actual evapotranspiration (ETa) of your plants, weigh the selected pots daily. The change in water weight, divided by the surface area of the pot, gives you the daily ETa. Ensure your plants are consistently well-watered throughout this experiment, so that actual ET closely approximates potential crop ET.
Calculate Potential Evapotranspiration (ETr or ETo): Utilize the collected microclimate data (solar radiation, relative humidity, air temperature, wind speed) and the Penman-Monteith evapotranspiration model (Allen et al., 1998) to calculate the daily potential evapotranspiration (ETr for a reference alfalfa crop or ETo for a reference grass crop).
Determine the Crop Coefficient (Kc): Divide the actual evapotranspiration (ETa) by the potential evapotranspiration (ETr) for each day. Plot these daily Kc values against the number of days since planting. The resulting graph will represent your crop coefficient curve as a function of crop development stage.
Refining Crop Coefficient with Imaging
For more precise estimations of crop ET that directly reflect actual crop growth rather than just the passage of time, incorporate the following imaging steps:
Capture Daily Canopy Images: Every day, take a top-down image of your plant pots using an RGB or, preferably, a multispectral camera.
Determine Ground Cover Percentage (C): Process these images to calculate the percentage of ground covered by the plant canopy (C, %). This step requires some basic image processing knowledge (see Fig. 1).
Develop a Ground Cover Function: Plot the calculated canopy cover (C) values against the corresponding crop coefficient (Kc) values obtained from the weighing method. You can then fit a polynomial equation to this data, establishing a relationship between canopy cover and the crop coefficient:
Kc=a×C2+b×C+m

Automating ETa Estimation with Computer Vision
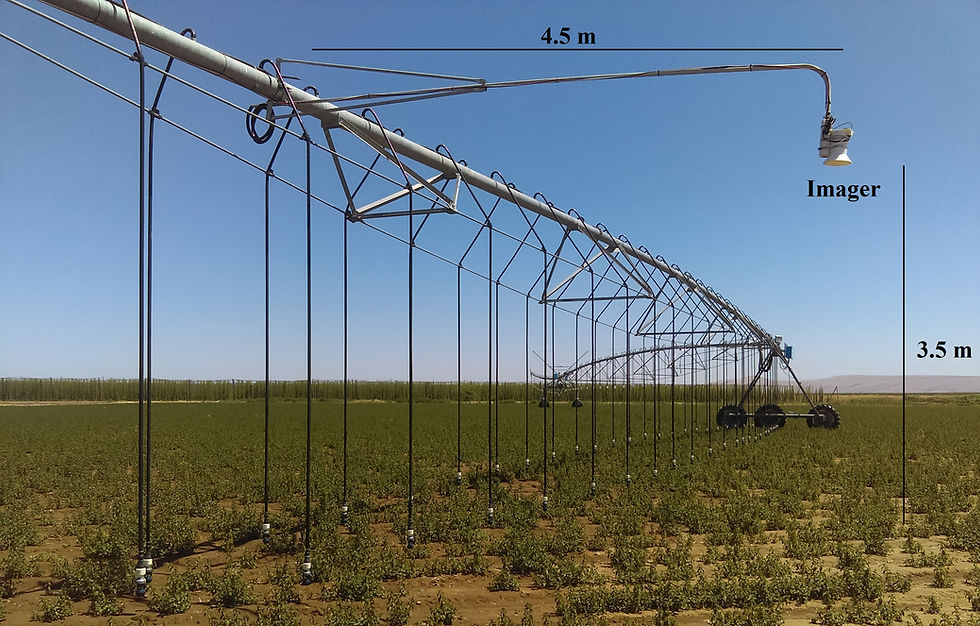
For those interested in full automation, it's possible to build a low-cost computer vision system, similar to this one, and integrate the necessary crop models directly into the system's software. This approach is suitable for both indoor and outdoor growing environments.
In my own project, I extracted crop coefficient functions for several crops, including lettuce, garlic, and tomatoes, from existing literature (Bryla et al., 2010) and integrated them into the system's software. To measure crop ET, I simply connect a commercially available microclimate sensor unit to the system's SDI-12 port and capture a top-view image of the plants. The system then automatically calculates the crop ET and other relevant parameters, geotags and timestamps the results, and saves them in a CSV file.

This same automation principle can be applied to other imaging platforms, such as unmanned aerial vehicles (UAVs), by incorporating embedded systems and custom coding, or even potentially on a smartphone. However, a low-cost handheld system offers advantages for research and small-scale farming by reducing latency and enabling more immediate decision-making.
Moving Beyond ET: Utilizing Actual and Potential Transpiration
While ET-based water management is a valuable tool, it has its limitations. I have previously discussed in an article, "Unraveling Apple Tree Water Needs: Why the Penman-Monteith Model Falls Short", why the Penman-Monteith ET model may not be universally applicable across all crops.
In essence, the widely used Penman-Monteith model, which forms the basis of the methods described above, was originally developed for short, dense canopies like grass or alfalfa. These canopies exhibit significant differences compared to many other plant types. For instance, the PM model doesn't fully account for stomatal regulation in response to strong coupling between sparse canopies and the surrounding air humidity.
This realization led me to focus on modeling the biophysical processes of actual transpiration (Ta) and potential transpiration (Tp) – as distinct from evapotranspiration (ET), which combines both evaporation and transpiration – as part of my academic research. Ta and Tp provide valuable insights on their own and can also be used to calculate the Crop Water Stress Index (CWSI), a key indicator of both biotic and abiotic plant stress.
Accessing the Source Code for Ta and Tp Estimation
For a considerable time, I've intended to share the source code (embedded software in C/C++ using Qt and OpenCV) for my computer vision system on GitHub. However, the demands of research often left little time for the necessary code cleanup and organization.
Recently, I've begun the process of reviewing, reorganizing, and sharing specific components of the code that I believe will be beneficial to others. This particular piece of code, now available on GitHub at https://github.com/envitronicslab/CWSI_Function, is written in both C/C++ (compatible with embedded Linux systems) and Python and includes the theoretical (biophysical) models for calculating actual and potential transpiration using microclimate and plant canopy surface temperature data.
The code is designed with a modular structure, and all relevant equations are encapsulated within a C++ class or Python library. This facilitates easy integration into other software projects. I have also included example code in a separate module for demonstration and testing purposes. While the code is functional, relatively clean, and largely optimized, further refinement could undoubtedly enhance it.
Citation
Osroosh, Y., 2021. How to Use Computer Vision for Automatic Estimation of Crop Water Needs. EnviTronics Lab, April 30.
References
Allen, R.G., Pereira, L.S., Raes, D., Smith, M., 1998. Crop evapotranspiration: guidelines for computing crop water requirements. Irrigation and Drainage Paper No. 56. FAO, Rome, Italy, 300 pp.
Bryla, D.R., Trout, T.J. and Ayers, J.E., 2010. Weighing Lysimeters for Developing Crop Coefficients and Efficient Irrigation Practices for Vegetable Crops. HortScience, 45: 1597-1604.


Comments